- Installs
- —
- Apple does not publish download counts
- Rating
- 5.0
- Ratings
- 1
- 1 reviews
- Version
- 1.43
- Updated 6 Feb 2023
- Released
- 23 Aug 2012
- Tracked since 11 May 2026
- Size
- 18 MB
- Needs 12.0
Screenshots





About Teaching Graphs
The description on the store listing
Don't know the difference between a Venn and a Carroll Diagram? Don't know how to use one? Find that using Spreadsheet programs to be a lesson in everything but Graphs and interpretation? Spreadsheet Programs can be complex and distracting with too many features.... Teaching graphs is a simple introduction to basic graphs and interpretation of data.
Teaching graphs includes two types of activities, 'Read' and 'Make' including picture graphs, Venn & Carroll diagrams, bar, pie and line charts.
Students are asked to read and interpret data from four types of graphs, coming to recognise the features and purposes of each graph type. Students are also able to collect their own data and …
Read the full description
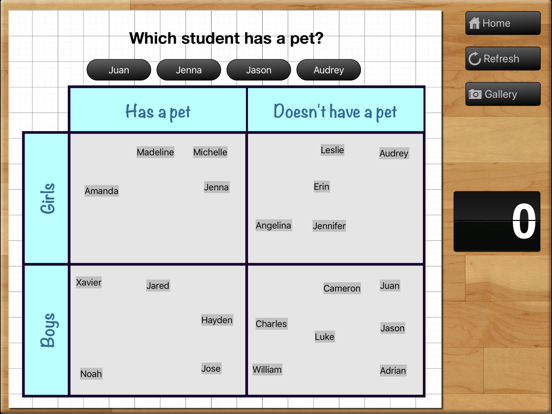
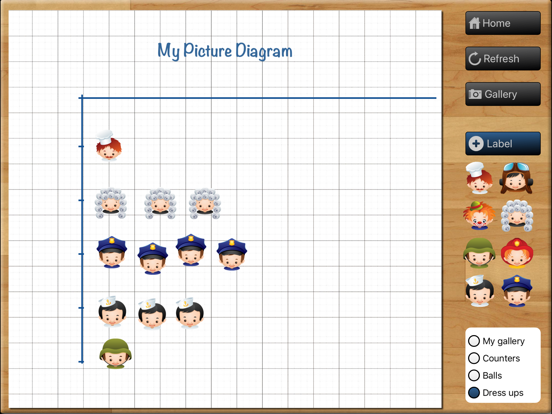
Don't know the difference between a Venn and a Carroll Diagram? Don't know how to use one? Find that using Spreadsheet programs to be a lesson in everything but Graphs and interpretation? Spreadsheet Programs can be complex and distracting with too many features.... Teaching graphs is a simple introduction to basic graphs and interpretation of data. Teaching graphs includes two types of activities, 'Read' and 'Make' including picture graphs, Venn & Carroll diagrams, bar, pie and line charts. Students are asked to read and interpret data from four types of graphs, coming to recognise the features and purposes of each graph type. Students are also able to collect their own data and create their own graphs (4 different types of graphs) They can set labels, colours and adding values. Students can email a graph or save the graph to photo gallery. READ GRAPHS There are four types of graphs that have various questions asked. =Venn diagram= The most overused type of diagram in early years education! Little Johnny likes apples and pears, but Sara likes apples and bananas! Although we have included that type of question in the App, this is just the beginning of what a Venn diagram is REALLY used for. Once students have the basics, a Venn diagram can also be used to show more complex ideas in a visual and logical manner, helping children to make links between the similarities and differences of a particular set one example is comparing sets (or traits) such as motorbikes vs bicycles. =Carroll diagram= A Carroll diagram is used to sort information in a 'Yes / No' manner . This type of diagram aids students to organise information in a systematic manner. In the App, we have used two attributes (a 2 x 2 grid). =Weather graph (bar chart)= This module creates a minimum and maximum bar chart for the next five days of weather in your location. You can switch between Fahrenheit and Celsius. The module asks recall questions about the weather, I.e. 'What is the hottest day?' =Picture graph= Picture graphs are often the first introduction to graphing. It is important to note that the pictures are the SAME size and spaced evenly. Instead of traditional bar shapes each value is incremented using pictures. We've included marbles, sports balls, musical instruments and student dress-ups. MAKE GRAPHS There are 4 types of graphs that can be created. Students can email or save graphs to the photo gallery which allows record keeping for later instruction or comparison between appropriate graph types for a particular purpose. (You probably wouldn't use a venn diagram to show temperature across a week, a bar or line graph is more suited...but what a good teaching point.) =Venn diagram= Create a Venn diagram with 2 or 3 intersecting circles. Students can label each circle and set the colour. Items can be added and dragged in to place. =Line/bar graph maker= Create a single series bar or line graph. Switch between the two types of graph depending on the type of data. The line colour and bar colour can be set and items can be labelled. Line graphs are more appropriate for accumulative data sets such as temperature over one day whereas bar graphs can be used for temperature across a week. =Carroll diagram= A 2 row by 2 column Carroll diagram can be created. Labels and items can be customised. =Pie chart maker= Pie chart creation can be difficult without the assistance of IT devices as young children aren't able to understand the mathematics behind its creation (angles, using a protractor,) Students are able to create their pie chart by inputting data sets, change the colour and value for each slice. Great introduction to percentages for more advanced students..work backwards and complete the task on the App and (oh my goodness, yes, I'll say it...) by HAND!
Installs
Apple does not publish download counts. Estimates are in testing.
We publish iOS estimates only after they pass a back-test against real numbers. Chart history below is measured.
Estimated store revenue Estimated Beta
App Store, worldwide, monthly rate from the last 14 chart days to 21 Nov 2026
Below the top 100 grossing apps in the markets we calibrate. In the United States that usually means under about $6.4M a month. App Store purchases and subscriptions only, before Apple's 15 to 30% fee. Ads and web payments are not included.
Ratings
1 ratings, 1 reviews
No rating breakdown published for this app.
Recent reviews
Latest public reviews from the store
No reviews in our sample for this app yet.
Top chart positions
Latest App Store chart ranks by country, last 10 days
Not in any tracked top chart in the last 10 days.
Teaching Graphs history
Release, install milestones, listing and store changes
- First released on the store 23 Aug 2012
Recent versions
Current version 1.43
- Version 1.436 Feb 2023
Dark mode fixes
Listing keywords
Words and phrases Teaching Graphs repeats most in its store listing
Top phrases: venn diagram (6), carroll diagram (5), types of graphs (4), pie chart (3), teaching graphs (3).
Highlighted words also appear in the title. Counts cover the title, short description and description.
Compliance
What the listing and the app package show
- Store status
- Live
- Upkeep
- No update since 6 Feb 2023
- Age rating
- 4+
Apps like Teaching Graphs
 Populations and Resources SimAmplify Education, Inc.★ 2.38
 Rune WriterPaul Burlov★ 4.34
 Being Moroccan ( Darija )Yasir TIRAK★ 4.56
 方格单词²上海译动智能科技有限公司★ 4.68
 Handwriting Tracing PracticeVladimir Zavada★ 4.02
 Oklahoma Learners Permit TestNilu Rathod★ 4.72
 SU CampusCharles Robinson★ 4.76
 NC CDL Permit Test PracticeNilu Rathod★ 4.82
 Mjølnir NorwegianMjølnir Learning Apps★ 4.92
Teaching Graphs: questions and answers
Who makes Teaching Graphs?
Teaching Graphs is published by Aleesha Kondys.
When was Teaching Graphs last updated?
The latest version (1.43) was released on 6 Feb 2023.
Is Teaching Graphs free?
No. Teaching Graphs is a paid app priced at $2.99.
Is Teaching Graphs still available?
Yes. Teaching Graphs is live on App Store as of 1 Jul 2026.
Track Teaching Graphs and its competitors
Watch any app for new versions, rating drops, chart moves and removals. Free plan, no card.