Graphical Analysis GW (Go Wire
Not for use with VERNIER GO DIRECT® sensors. Use Graphical Analysis 4 instead.
- Installs
- 82.81K
- Measured
- Rating
- 3.38
- Ratings
- 187
- 24 reviews
- Version
- Varies with device
- Updated 11 Jun 2018
- Released
- 15 May 2014
- Tracked since 13 May 2026
- Size
- —
Screenshots
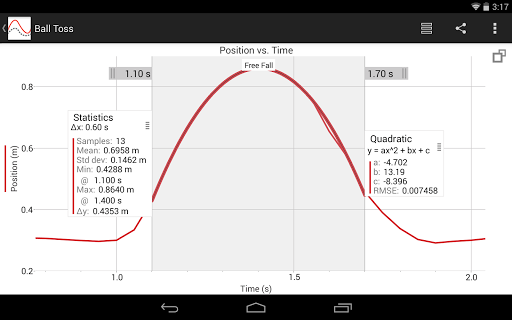
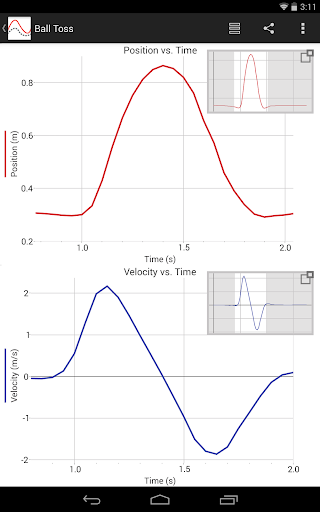
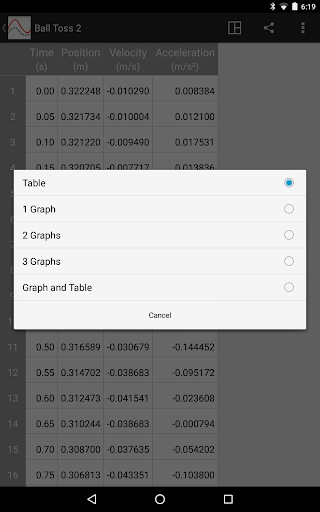
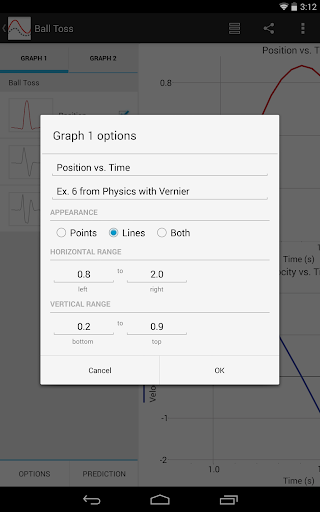
About Graphical Analysis GW (Go Wire
The description on the store listing
Graphical Analysis™ GW is a tool for science students to collect, graph, and analyze data from Vernier Go Wireless® sensors.
Sensor data-collection support:
• Vernier Go Wireless® Temp and Go Wireless pH sensors
• Vernier Go Wireless Heart Rate and Go Wireless Exercise Heart Rate monitors
• Vernier LabQuest® sensors used with Go Wireless Link or LabQuest Stream interfaces
Additional experiment options:
• Data Sharing via Wi-Fi connection to LabQuest 2 or Logger Pro® 3
• Built-in Sensors (accelerometers)
• Manual Entry
Note: Sensor data collection and Data Sharing require the purchase of hardware from Vernier Software & Technology. Built-in sensor and manual entry of data can …
Read the full description
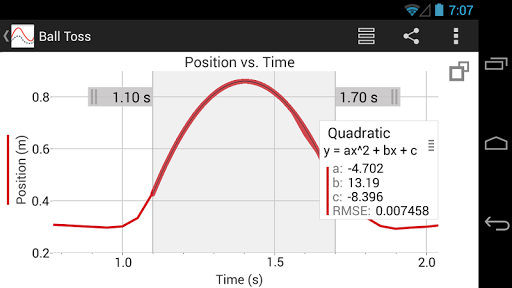
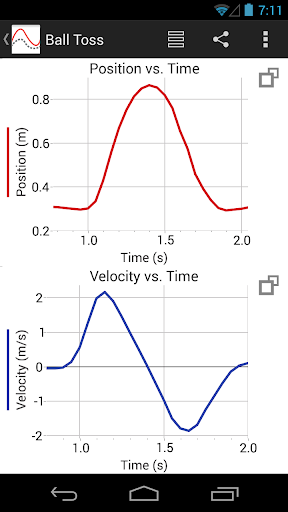
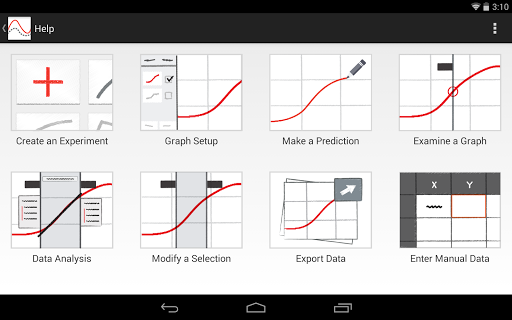
Graphical Analysis™ GW is a tool for science students to collect, graph, and analyze data from Vernier Go Wireless® sensors. Sensor data-collection support: • Vernier Go Wireless® Temp and Go Wireless pH sensors • Vernier Go Wireless Heart Rate and Go Wireless Exercise Heart Rate monitors • Vernier LabQuest® sensors used with Go Wireless Link or LabQuest Stream interfaces Additional experiment options: • Data Sharing via Wi-Fi connection to LabQuest 2 or Logger Pro® 3 • Built-in Sensors (accelerometers) • Manual Entry Note: Sensor data collection and Data Sharing require the purchase of hardware from Vernier Software & Technology. Built-in sensor and manual entry of data can be performed without a hardware purchase. For more information on Data Sharing, visit http://www.vernier.com/css Key Features - Data Collection • Multi-sensor data-collection support (requires LabQuest Stream) • Time Based, Event Based data-collection modes • Configurable data-collection rate and duration for time-based data collection • Option to zero sensor readings • Manual entry of data from keyboard and clipboard Key Features - Data Analysis • Display one, two, or three graphs simultaneously • View data in a table or show a graph and table side-by-side • Draw Predictions on a graph to uncover misconceptions • Examine and select data • Apply Statistics calculations to find mean, min, max, and standard deviation • Perform curve fits, including linear, quadratic, natural exponent, and more • Pinch to scale graphs Key Features - Collaboration and Sharing • Create text annotations and add graph titles • Export graphs and data for printing and inclusion in lab reports • Export data in .CSV format for analysis of data in spreadsheet software such as Excel®, Google Sheets™, and Numbers® Note: The above features apply to version 3.2 only, available for devices running Android OS version 4.3 or newer. Android devices running OS versions 4.1-4.22 will receive Graphical Analysis version 1.2, which only supports Data Sharing, Built-in Sensors, and Manual Entry experiments. Vernier Software & Technology has over 35 years of experience in providing effective learning resources for understanding experimental data in science and math classrooms. Graphical Analysis GW is a part of the extensive system of sensors, interfaces, and data-collection software from Vernier for science and STEM education.
Installs since 29 Aug 2026 Measured
Exact Google Play install counts, collected daily
Ratings
187 ratings, 24 reviews
- 5 ★58%
- 4 ★10%
- 3 ★0.0%
- 2 ★0.0%
- 1 ★31%
Recent reviews
Latest public reviews from the store
No reviews in our sample for this app yet.
Top chart positions
Latest Google Play chart ranks by country, last 10 days
Not in any tracked top chart in the last 10 days.
Graphical Analysis GW (Go Wire history
Release, install milestones, listing and store changes
- Reached 50,000+ installs 6 Jun 2018
- Reached 10,000+ installs 22 Sep 2015
- Reached 5,000+ installs 11 May 2015
- Reached 1,000+ installs 25 Nov 2014
- Reached 500+ installs 9 Nov 2014
- Reached 100+ installs 21 Sep 2014
- Reached 50+ installs 23 Jul 2014
- Reached 10+ installs 2 Jun 2014
Recent versions
Current version Varies with device
- Version 3.24 Jun 2018
- Version 3.1.111 Nov 2016
- Version 3.127 Oct 2016
- Version 3.0.127 Jul 2016
Listing keywords
Words and phrases Graphical Analysis GW (Go Wire repeats most in its store listing
Top phrases: data collection (8), go wireless (6), graphical analysis (5), data sharing (4), manual entry (4).
Highlighted words also appear in the title. Counts cover the title, short description and description.
Business model and tech
From the store listing, the SDKs in the app package and its declared permissions
- Business model
- Free to download
- Built with
- No cross-platform framework or game engine detected
- Ad networks (0)
- None detected
- Sensitive access
- LocationCameraPhotos, videos and filesNearby devices
0 ad, attribution and analytics SDKs detected. SDKs are read from the app package and permissions from the store listing, so code that loads later is not seen.
Technology
3 SDKs found in the app package
Development tools
15 permissions
0 special access, 4 sensitive, 11 standard
- Take photos and videosSensitive
- Change or delete shared storageSensitive
- Read shared storageSensitive
- Approximate locationSensitive
- Control the flashlightStandard
- Control vibrationStandard
- Keep the phone awakeStandard
- Access Bluetooth settingsStandard
- Pair with Bluetooth devicesStandard
- Connect to and disconnect from Wi-FiStandard
- Full internet accessStandard
- See network connectionsStandard
Compliance
What the listing and the app package show
- Store status
- Live
- Upkeep
- No update since 11 Jun 2018
- Registered in
- United States
- Privacy policy
- Linked on the listing
- Advertising
- No ads declared
- In-app purchases
- None declared
- Age rating
- Everyone
- Sensitive permissions
- 4 sensitive of 15
- Location access
- Yes, while in use
- Camera and microphone
- Camera
Apps like Graphical Analysis GW (Go Wire
Escuela Bíblica VirtualEvangelismo y Ministerio Personal25.2K installs★ 3.67
Singularity by VaonisVaonis20.8K installs★ 3.68
Exoplanet HunterVaroid21.6K installs★ 4.36
CLAT Exam Preparation App 2023Youth4work18.4K installs★ 4.2
B.R. Global School SirsaZimong Software Private Limited5.8K installs★ 4.1
Form 2 notes, All subjectsLogiciel Puissant83.4K installs★ 4.0
Norae: Learn Real KoreanTC Fusion14K installs★ 4.39
성균관대학교 전자출결Sungkyunkwan University46.4K installs★ 1.5
Egyptian hieroglyphs KeyboardHonso28.9K installs★ 2.56
Graphical Analysis GW (Go Wire: questions and answers
How many downloads does Graphical Analysis GW (Go Wire have?
Graphical Analysis GW (Go Wire has 82,811 installs on Google Play, measured from the store's own count on 16 Nov 2026.
Who makes Graphical Analysis GW (Go Wire?
Graphical Analysis GW (Go Wire is published by Vernier Science Education, a developer based in US.
When was Graphical Analysis GW (Go Wire last updated?
The latest version (Varies with device) was released on 11 Jun 2018.
Is Graphical Analysis GW (Go Wire free?
Yes. Graphical Analysis GW (Go Wire is free to download.
Is Graphical Analysis GW (Go Wire still available?
Yes. Graphical Analysis GW (Go Wire is live on Google Play as of 16 Nov 2026.
Track Graphical Analysis GW (Go Wire and its competitors
Watch any app for new versions, rating drops, chart moves and removals. Free plan, no card.