
- Installs
- —
- Apple does not publish download counts
- Rating
- 3.67
- Ratings
- 3
- 3 reviews
- Version
- 9.0
- Updated 20 Dec 2025
- Released
- 27 Mar 2009
- Tracked since 10 May 2026
- Size
- 22 MB
- Needs 13.0
Screenshots


About SPL Graph
The description on the store listing
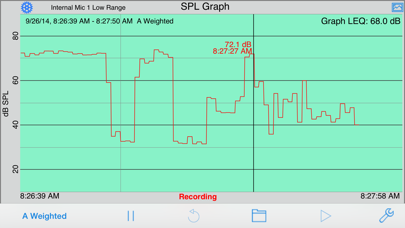
SPL Graph is an audio Sound Pressure Level (SPL) environmental noise analyzer, real-time frequency analyzer, chart recorder and data logger. It includes:
* Plot sound level over time
* Record audio while plot is running, playback to identify sounds that may have caused problems
* Capture video of events (optional in-app purchase)
* Do octave and 1/3 octave band analysis (optional in-app purchase)
* Show a 3D Plot of octave or 1/3 octave results
* Calculate Ln SPL values, L01, L10, L50, L90, L95, LMax and LMin
* Email notifications when sound exceeds pre-set limits
* Auto-save results after set intervals, and email the results to you
* Start another plot after auto-saving for continuous …
Read the full description
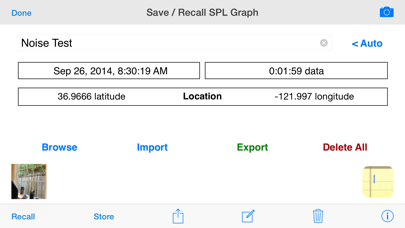
SPL Graph is an audio Sound Pressure Level (SPL) environmental noise analyzer, real-time frequency analyzer, chart recorder and data logger. It includes: * Plot sound level over time * Record audio while plot is running, playback to identify sounds that may have caused problems * Capture video of events (optional in-app purchase) * Do octave and 1/3 octave band analysis (optional in-app purchase) * Show a 3D Plot of octave or 1/3 octave results * Calculate Ln SPL values, L01, L10, L50, L90, L95, LMax and LMin * Email notifications when sound exceeds pre-set limits * Auto-save results after set intervals, and email the results to you * Start another plot after auto-saving for continuous operation SPL Graph works by averaging the SPL for a period of time that can vary from 0.1 second to 60 minutes, applying an optional weighting filter, and plotting the sound level, recording the raw audio signal, if recording is turned on. For sound intervals of 1.0 second to 60 minutes, the optional octave and 1/3 octave logging modules allows storing the spectrum of the sound, for each interval. The app works very well with the built-in iOS device microphone. To upgrade the app to true professional standards, add our iTestMic, iPrecisionMic, or iAudioInterface2 with an appropriate microphone, and get ANSI or ISO Type 1 or 2 results. With iPrecisionMic, you can send the system in to our calibration lab and get a calibration certificate for ISO 61672 and ANSI S1.4. SPL Graph can record up to 24 hours of sound level data, with single second resolution. The graph starts with a one-minute plot window, and as a minute is recorded, the graph re-scales automatically and adds another minute to show the data collected so far. The overall SPL level, or LEQ, is displayed for whatever portion of the test is showing on the graph. Tap the play button to play back the recorded audio, and you can use the cursor to scrub the audio location on the graph. Use this feature to listen to events that you can see on the graph. With the optional octave logging module, you can also record the octave or 1/3 octave band levels. And, you can view the data on the 3D plot for a graphical view of frequency over time. You can scroll and scale the graph vertically, in dB, by using standard swipe and pinch gestures. You can also scroll and expand and contract the time axis using gestures. Zoom out to a full 24 hours, or zoom in to a single minute, showing second resolution. Double-tap the screen to zoom out to show the entire graph on the screen. The time scale grid changes dynamically, highlighting minutes, ten-minute, and hour lines as as it runs. As the graph runs, the overall LEQ (average SPL) for the entire time period is computed and displayed on the screen. Swiping across the graph brings up a cursor that displays the exact dB level and time for any point on the graph. You can turn on audio recording, so that you have a record of the sounds that were happening while the graph was being stored. You can use this to figure out exactly what the sound was that caused a peak on the graph, for example. Recordings can be compressed or uncompressed. If you exit the app, or are interrupted with a phone call, the graph data will not be lost. SPL Graph will automatically save the graph, and reload it when you next open the program. You can also save a graph in one of ten files on the iPhone, so that you can recall the graph later. SPL Graph supports saving graphs directly on your iOS device. You can recall these graphs and bring them up on the screen, and listen to the sounds that were made while the graph was recorded. You can also store an image of the screen to your photo roll. Use Dropbox or iTunes Files Sharing to export the results to your computer. You can also export data in tab-delimited files for XLS import using iCloud. The filters are all ANSI type 1 or better, and include A-weighting, C-weighting, and all octaves band filters from 32 to 16kHz.
Installs
Apple does not publish download counts. Estimates are in testing.
We publish iOS estimates only after they pass a back-test against real numbers. Chart history below is measured.
Estimated store revenue Estimated Beta
App Store, worldwide, monthly rate from the last 12 chart days to 19 Nov 2026
Below the top 100 grossing apps in the markets we calibrate. In the United States that usually means under about $6.4M a month. App Store purchases and subscriptions only, before Apple's 15 to 30% fee. Ads and web payments are not included.
Ratings
3 ratings, 3 reviews
No rating breakdown published for this app.
Recent reviews
Latest public reviews from the store
No reviews in our sample for this app yet.
Top chart positions
Latest App Store chart ranks by country, last 10 days
- Countries ranked
- 2 of 50
- Best rank
- #36
- Top 10 placements
- 0
- of 2 chart placements
- Average rank
- #49.5
Best countries on App Store
- 🇳🇿 New Zealand · Top paid, Music#36
- 🇧🇷 Brazil · Top paid, Music#63
SPL Graph history
Release, install milestones, listing and store changes
- First released on the store 27 Mar 2009
Update frequency
How often SPL Graph ships a new version, month by month
1 updates in the last 12 months. About as often as similar apps, which shipped a median of 1 updates in the same year.
Recent versions
Current version 9.0
- Version 9.020 Dec 2025
-Bug fixes and stability improvements
Listing keywords
Words and phrases SPL Graph repeats most in its store listing
Top phrases: spl graph (6), sound level (3), octave and octave (2), octave or octave (2), second to minutes (2).
Highlighted words also appear in the title. Counts cover the title, short description and description.
Compliance
What the listing and the app package show
- Store status
- Live
- Upkeep
- Updated 20 Dec 2025
- Age rating
- 4+
Apps like SPL Graph
 Pyware 3D ViewerPygraphics, Inc.★ 2.86
 WNGC Your Georgia CountryCox Media Group★ 4.54
 Rhythm Necklace - Geometric SequencerSam Tarakajian★ 4.64
 DigiStix 2 AUv3 Plugin4Pockets.com★ 4.54
 JPLAYMarcin Ostapowicz★ 4.3
 MS Vinyl - Music WidgetDinh Dong Nguyen★ 4.26
 Radio TEDDYIR MediaAd GmbH★ 4.56
 Arpeggionome Pro | matrix arpeggiatorAlexandernaut★ 4.56
 Guitar & Ukulele Tuner 2025Aleksandr Kulaga★ 4.44
SPL Graph: questions and answers
Who makes SPL Graph?
SPL Graph is published by Andrew Smith.
When was SPL Graph last updated?
The latest version (9.0) was released on 20 Dec 2025.
Is SPL Graph free?
No. SPL Graph is a paid app priced at $9.99.
Is SPL Graph still available?
Yes. SPL Graph is live on App Store as of 1 Jul 2026.
Track SPL Graph and its competitors
Watch any app for new versions, rating drops, chart moves and removals. Free plan, no card.